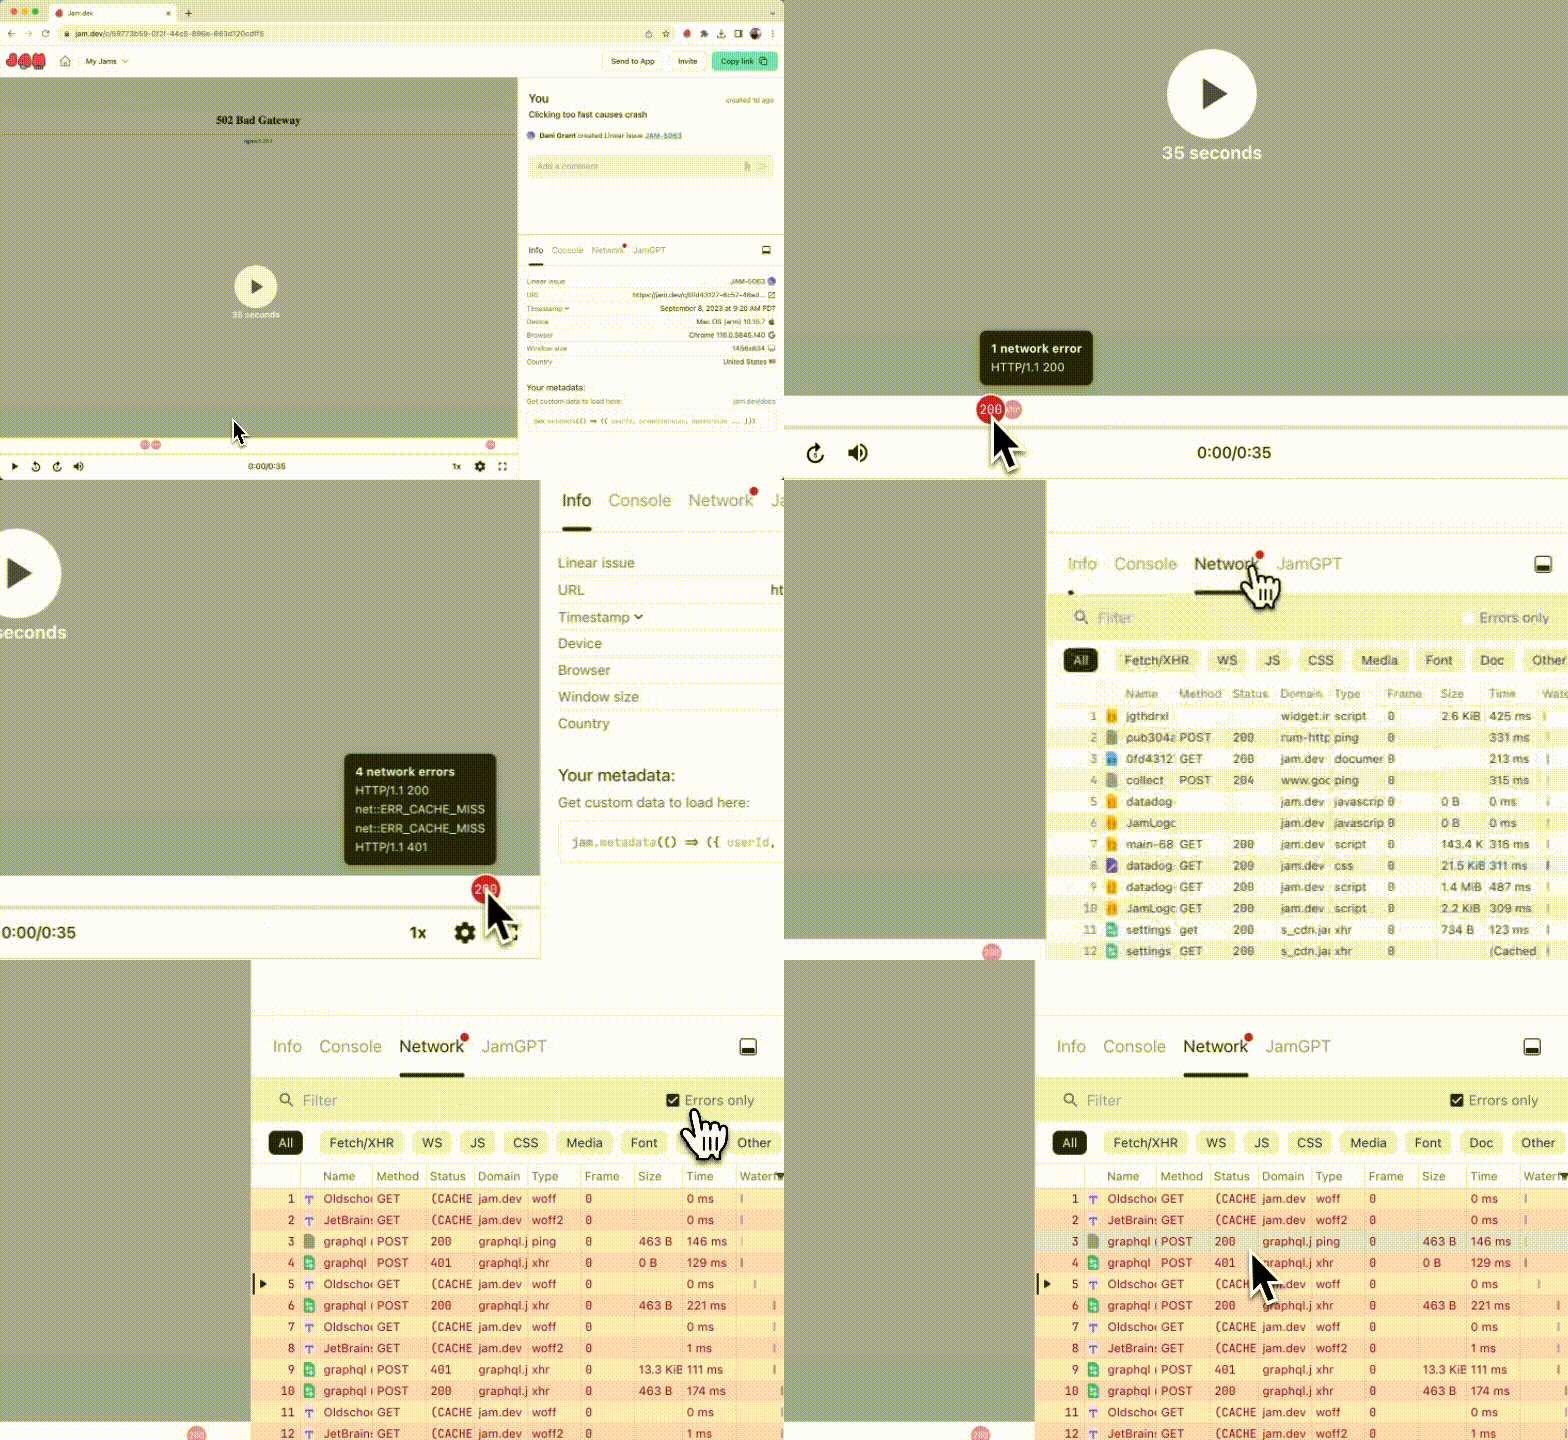
Introducing: GraphQL Debug Tools
GraphQL is extremely popular but notoriously time consuming to debug:
- While traditional APIs use HTTP status codes to help you filter which requests returned an error, every GraphQL request returns the same 200 “OK”, so developers have to look through every single request to find if one has errors.
- Unlike traditional APIs which use a different endpoint for each product function (e.g “/user” to get info about the user, etc) every GraphQL query reuses the same endpoint (“/graphql”), which makes it tedious to find the GraphQL request you’re looking for when debugging.
But not anymore! As GraphQL users ourselves, we spent a bunch of time thinking about what would make debugging GraphQL a lot faster…

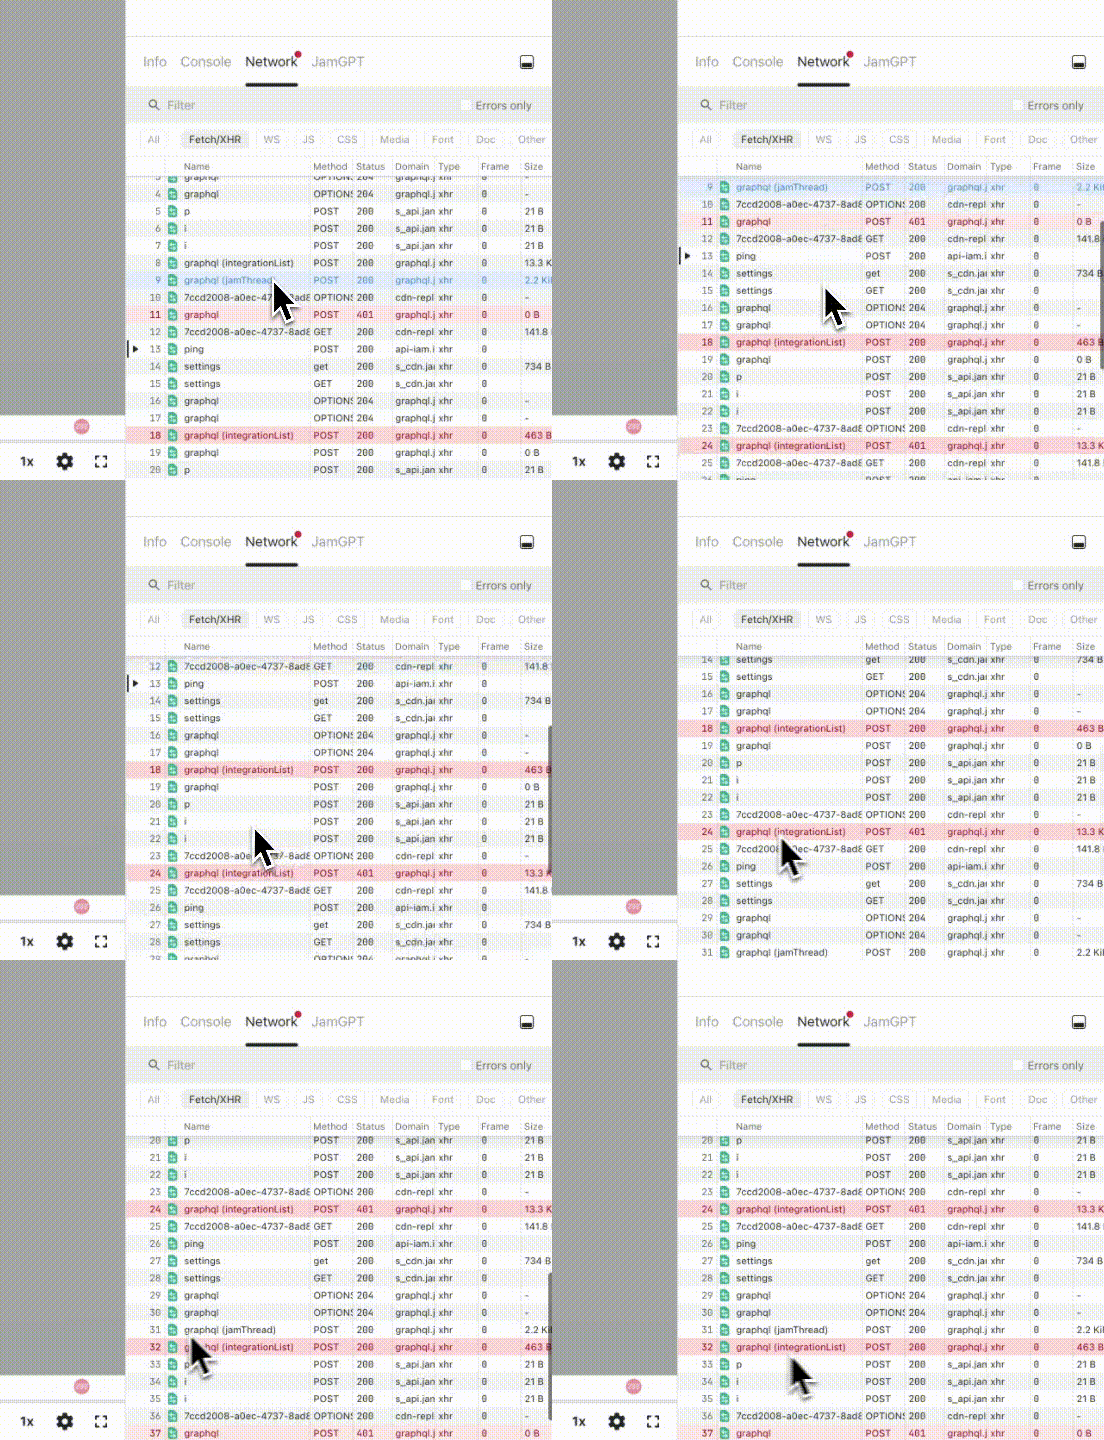
Next time you check out a Jam, you’ll see two features to make debugging faster for apps built with GraphQL:
Automatic Error Detection
Jam parses all the GraphQL queries to surface the ones with errors as errors, even though they return a 200 status. (In Chrome dev tools, they are all shown as status: OK, and you need to click into every request to see if it has errors)

Mutation Name Visibility
Jam now parses out which GraphQL request is for which mutation and surfaces the mutation name front and center in Jam dev tools, so it’s much easier to skim (or search) and find the important request to debug. (In Chrome dev tools, you need to click into each request to see the mutation name)

Happy faster GraphQL debugging!
As users of GraphQL ourselves, we’re so excited about this one and we’ve seen our own debugging speed up.
We hope you never have to use it because you’ll never have bugs, but if a bug or two does appear, we hope this saves you tons of time!
